
How to Read the Brain Map You Just Saw
A brain map is a painless recording of brain activity using sensors that rest on the scalp. There are no needles and no radiation.
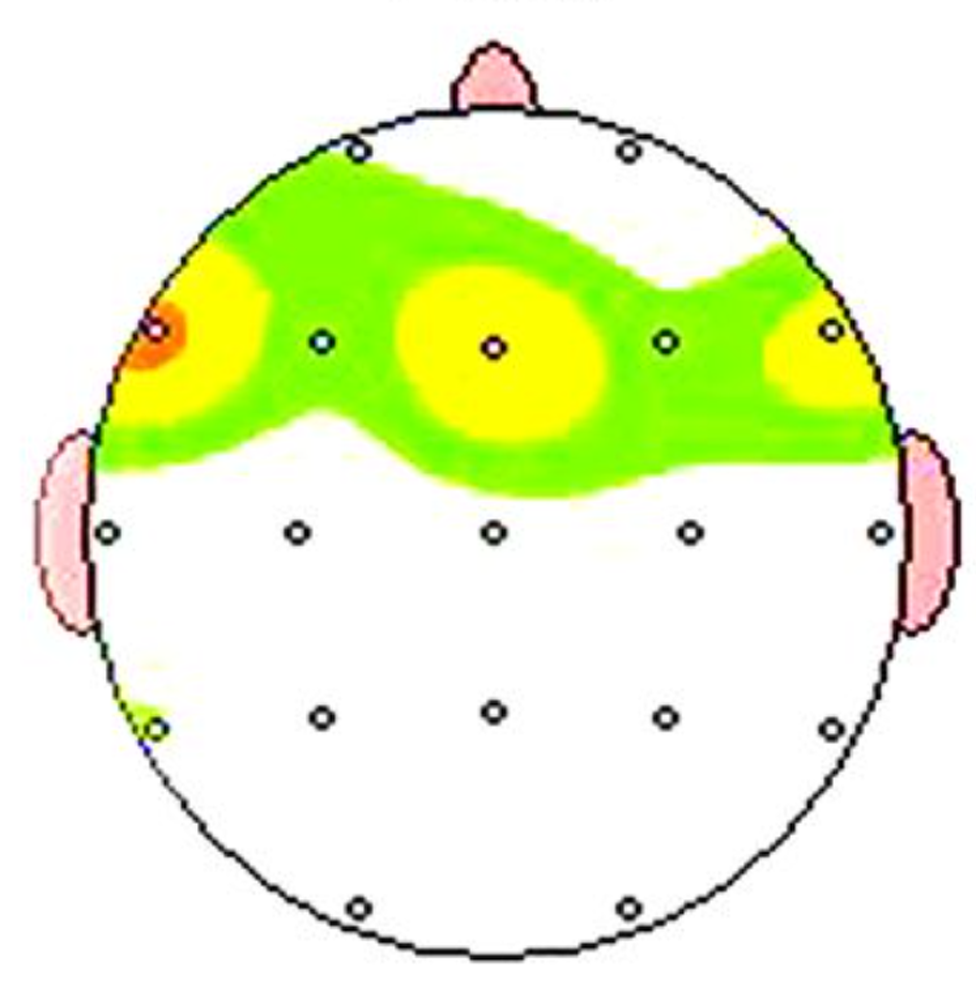
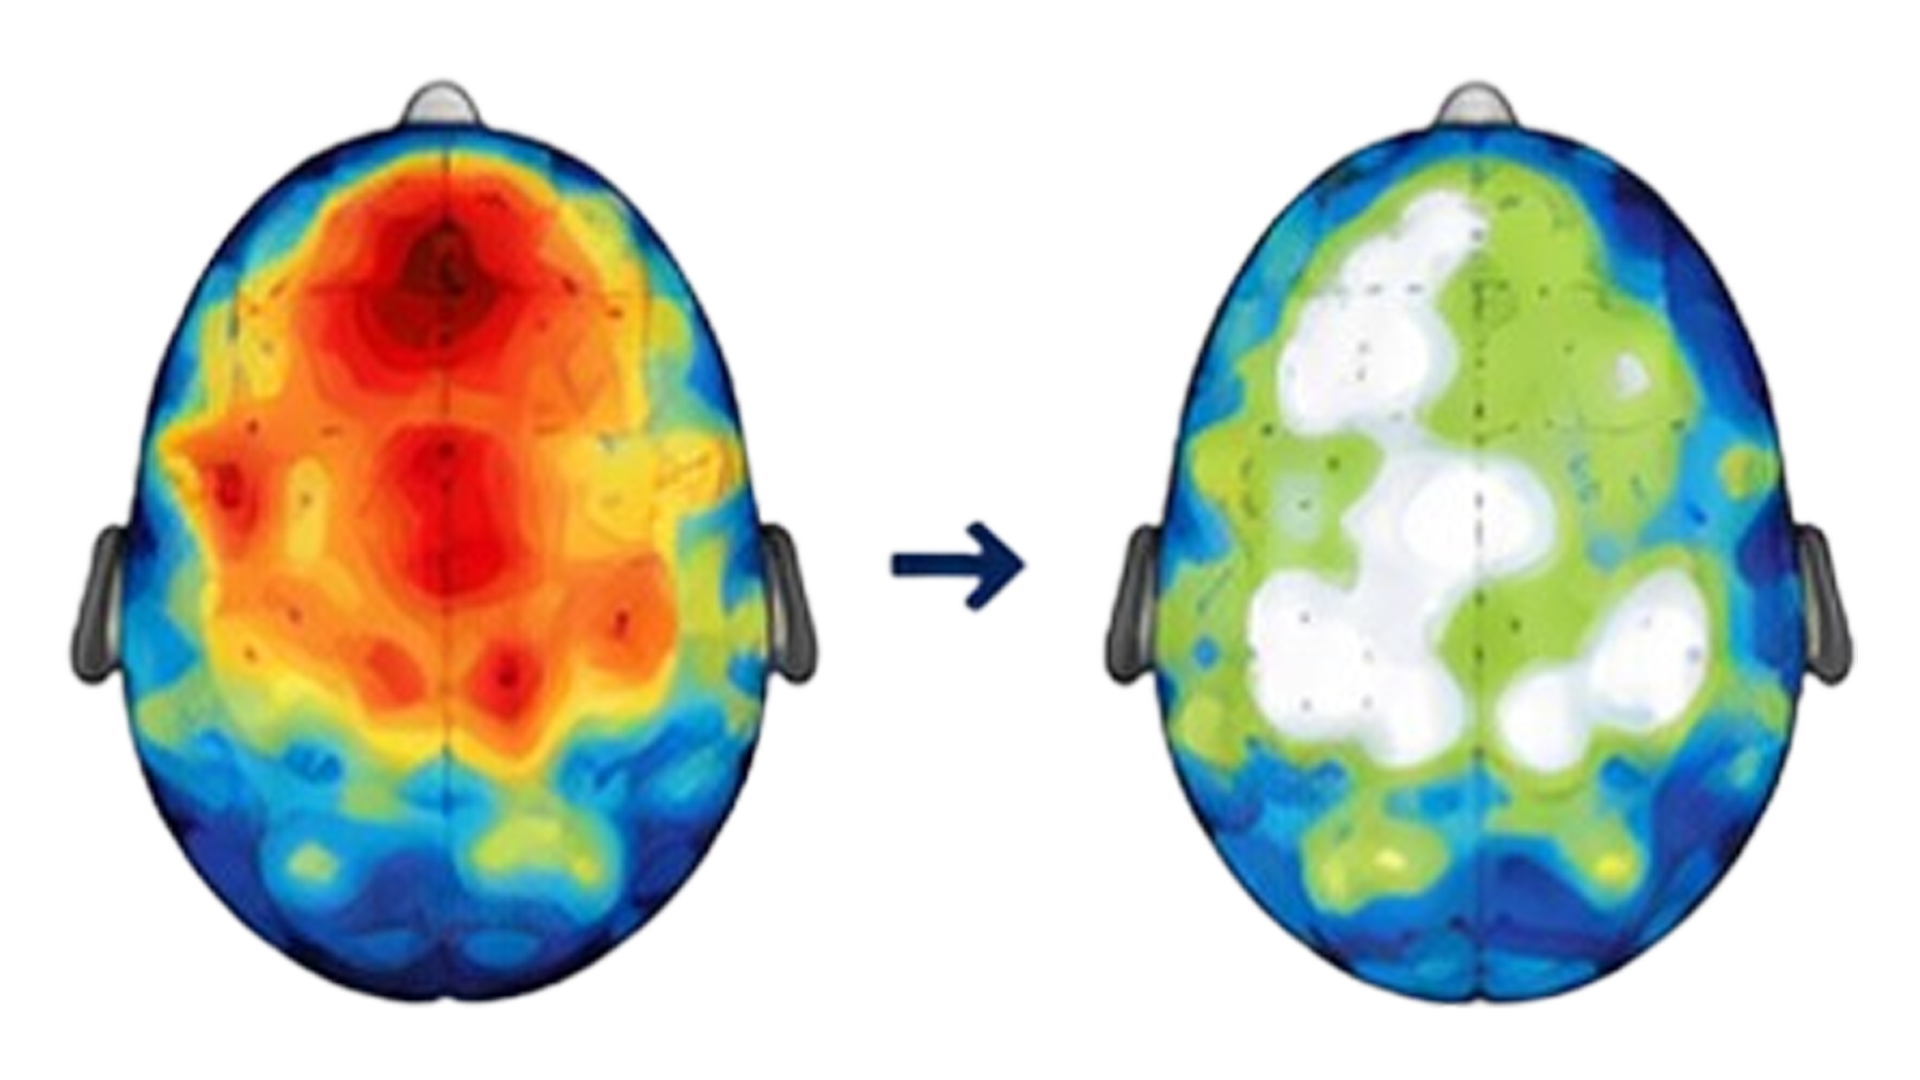
- White and green mark the healthy range.
- Warm colors mark areas with more activity than expected.
- Cool colors mark areas with less activity than expected.
- In the example above, the warm “hot spots” shrink toward green after 40 sessions, meaning this teen’s brain activity moved closer to the healthy range.
This is one real teen’s data, shared with all identifying details removed. It shows what a change in brain activity can look like, notwhat will happen for every young person.